
How to make charts in Figma
2025-05-06 — by Tommy Jepsen
How to make charts in Figma like Bar charts, Line charts, Pie charts, Area charts and more.
Chart Figma Plugin
Figma Plugins is plugins created by other Figma users to generate everything from special text effects to charts.
I've created my own chart generator to solve the pain of creating precise bar charts in Figma. Chart Generator - Bar, Pie, Line, Area and much more.. This plugin can also create Pie charts, Line charts, Bar charts, Stacked bar charts, Area charts, simple Treemaps and a couple more ✌️
Step 1: Open your Figma file
Open the file you want to add a chart into. It can be a Figma Design, Figjam or Slide file, any of them works with this chart plugin.
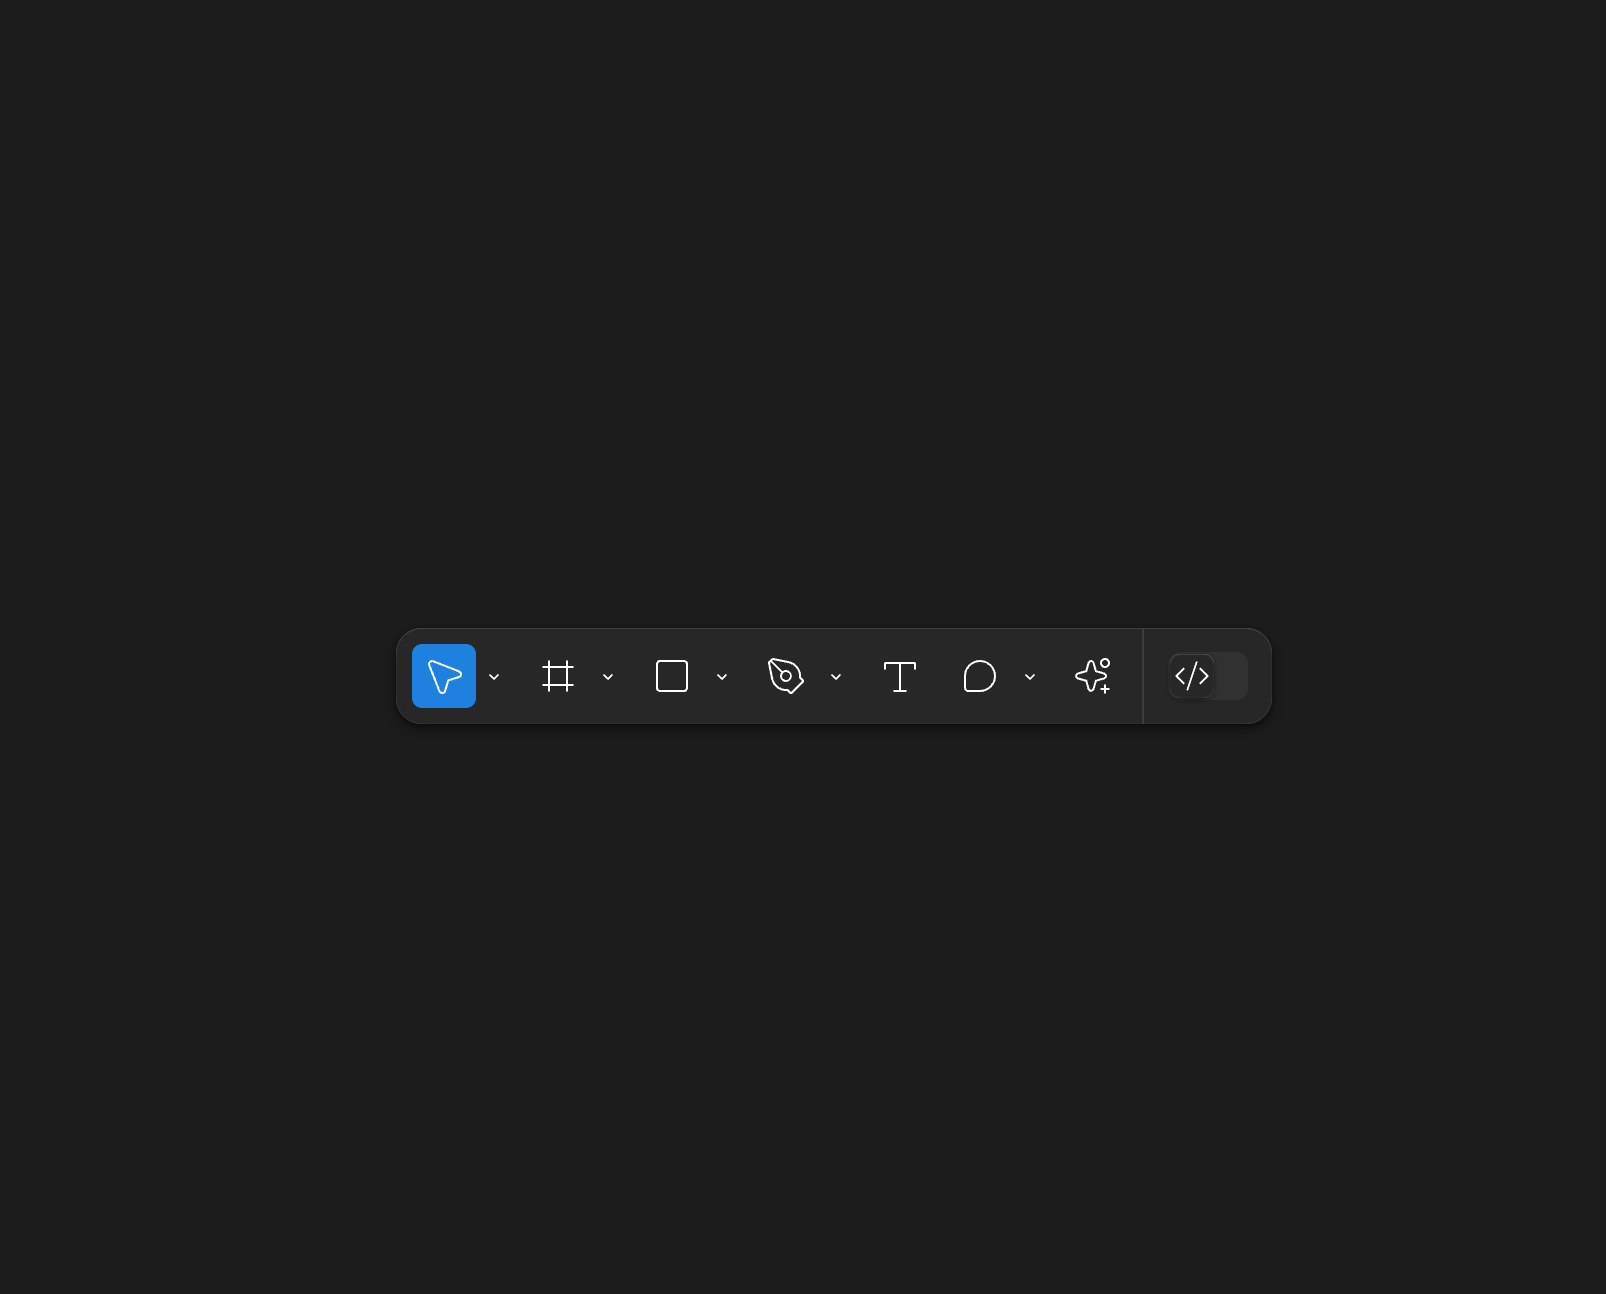
Step 2: Open Actions cmd+k
When you have located it, you can now open it and then go to step 3.
Step 3: Figma Chart Generator
Now search for the plugin "Chart Generator" by Tommy Jepsen. This can generate Bar charts and many more directly in Figma.
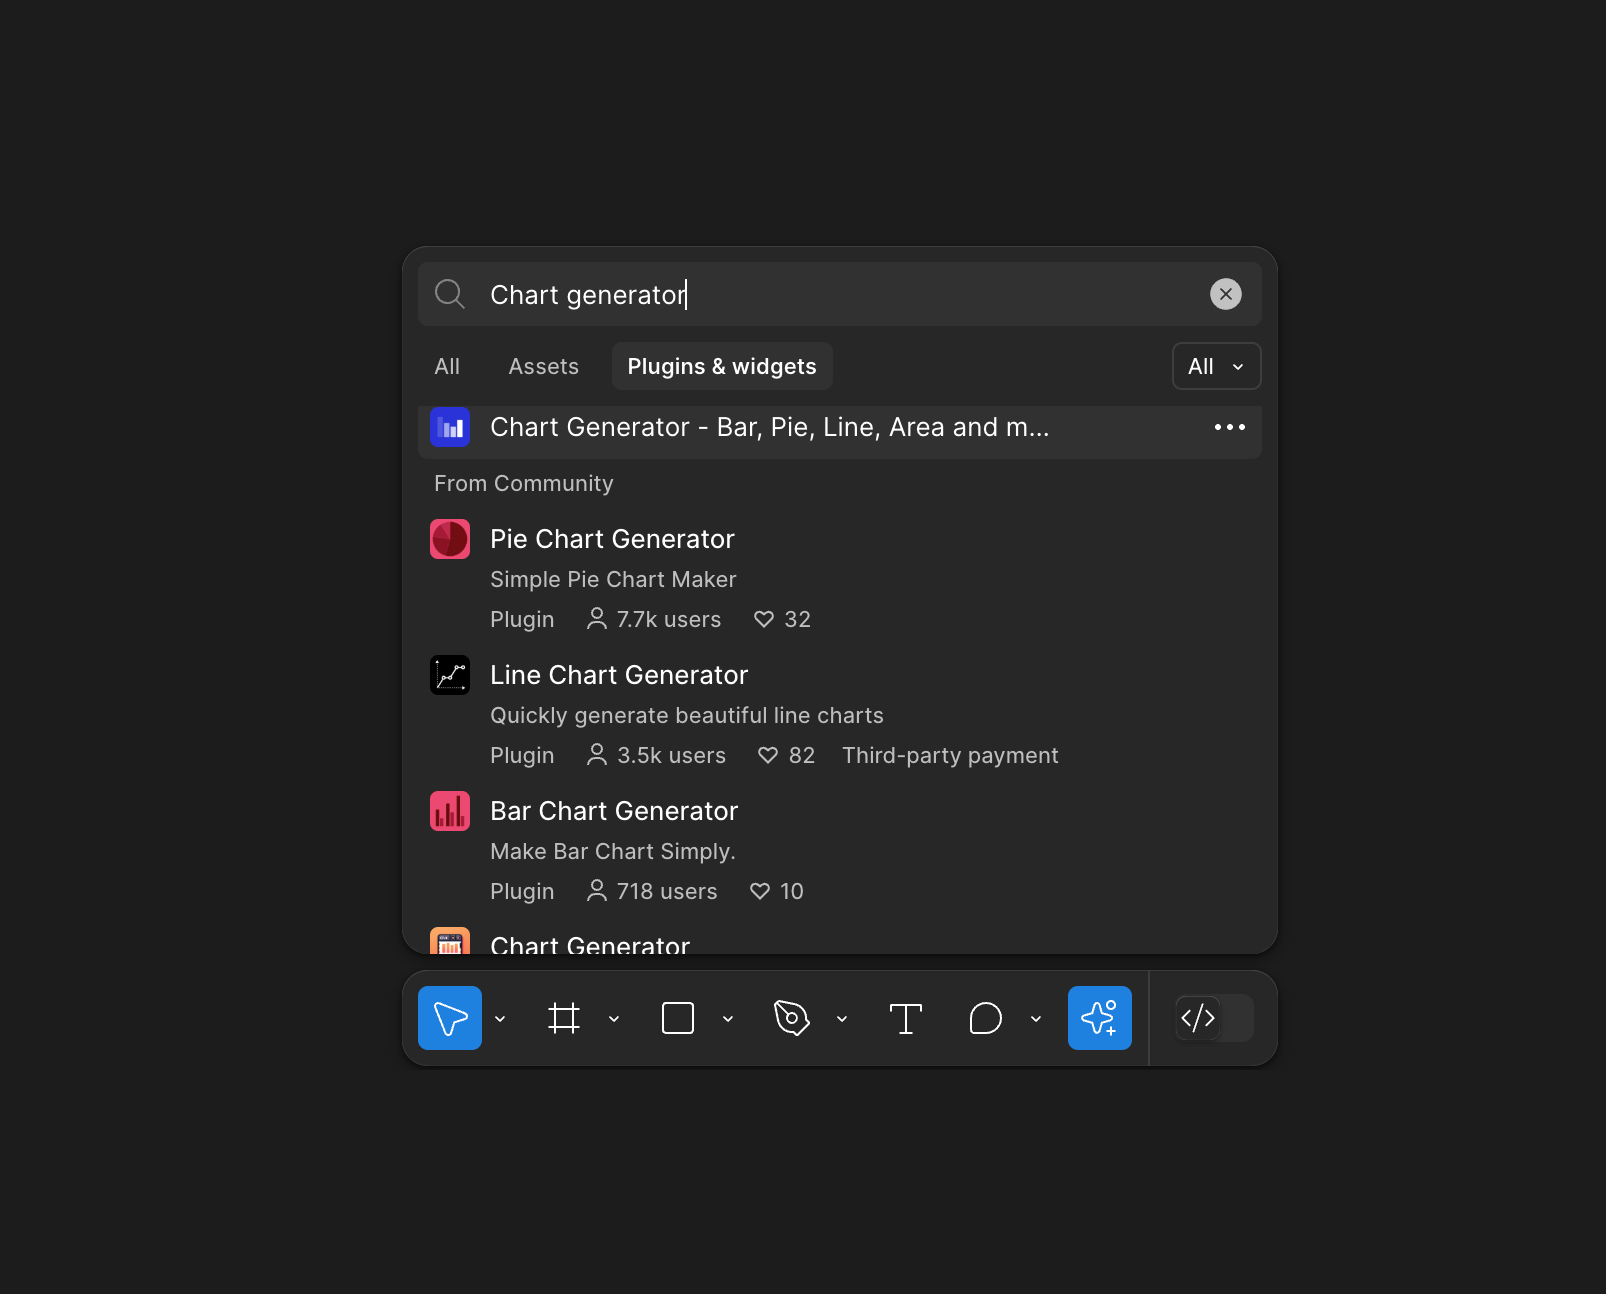
You can also find the Figma Charts plugin here: Chart Generator - Bar, Pie, Line, Area and much more... This Figma Charts plugin can generate Pie charts, Line charts, Bar charts, Stacked bar charts, Area charts, simple Treemaps and a couple more ✌️
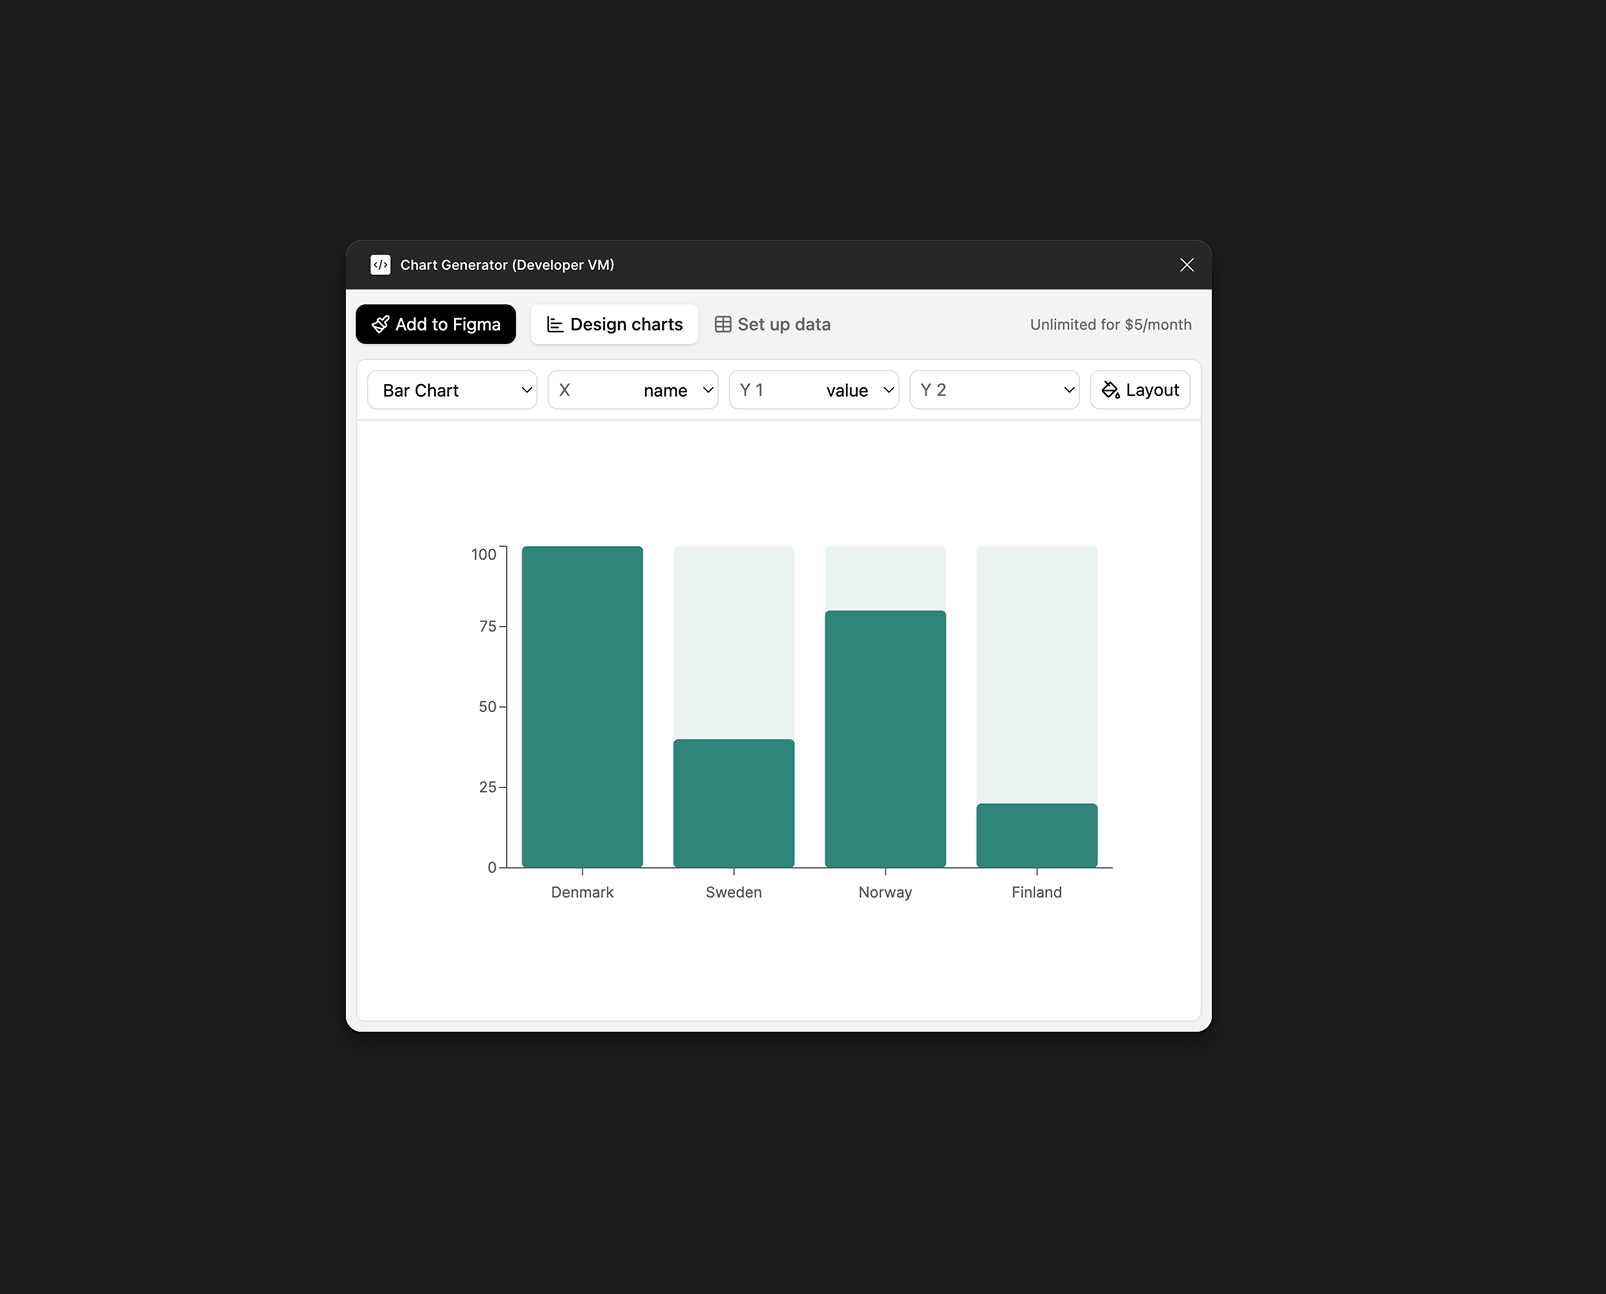
Step 4: Install it and use it
You hopefully now has opened the chart plugin. It should look something like this. You can choose many different charts in the dropdown, and style them in the layout option.
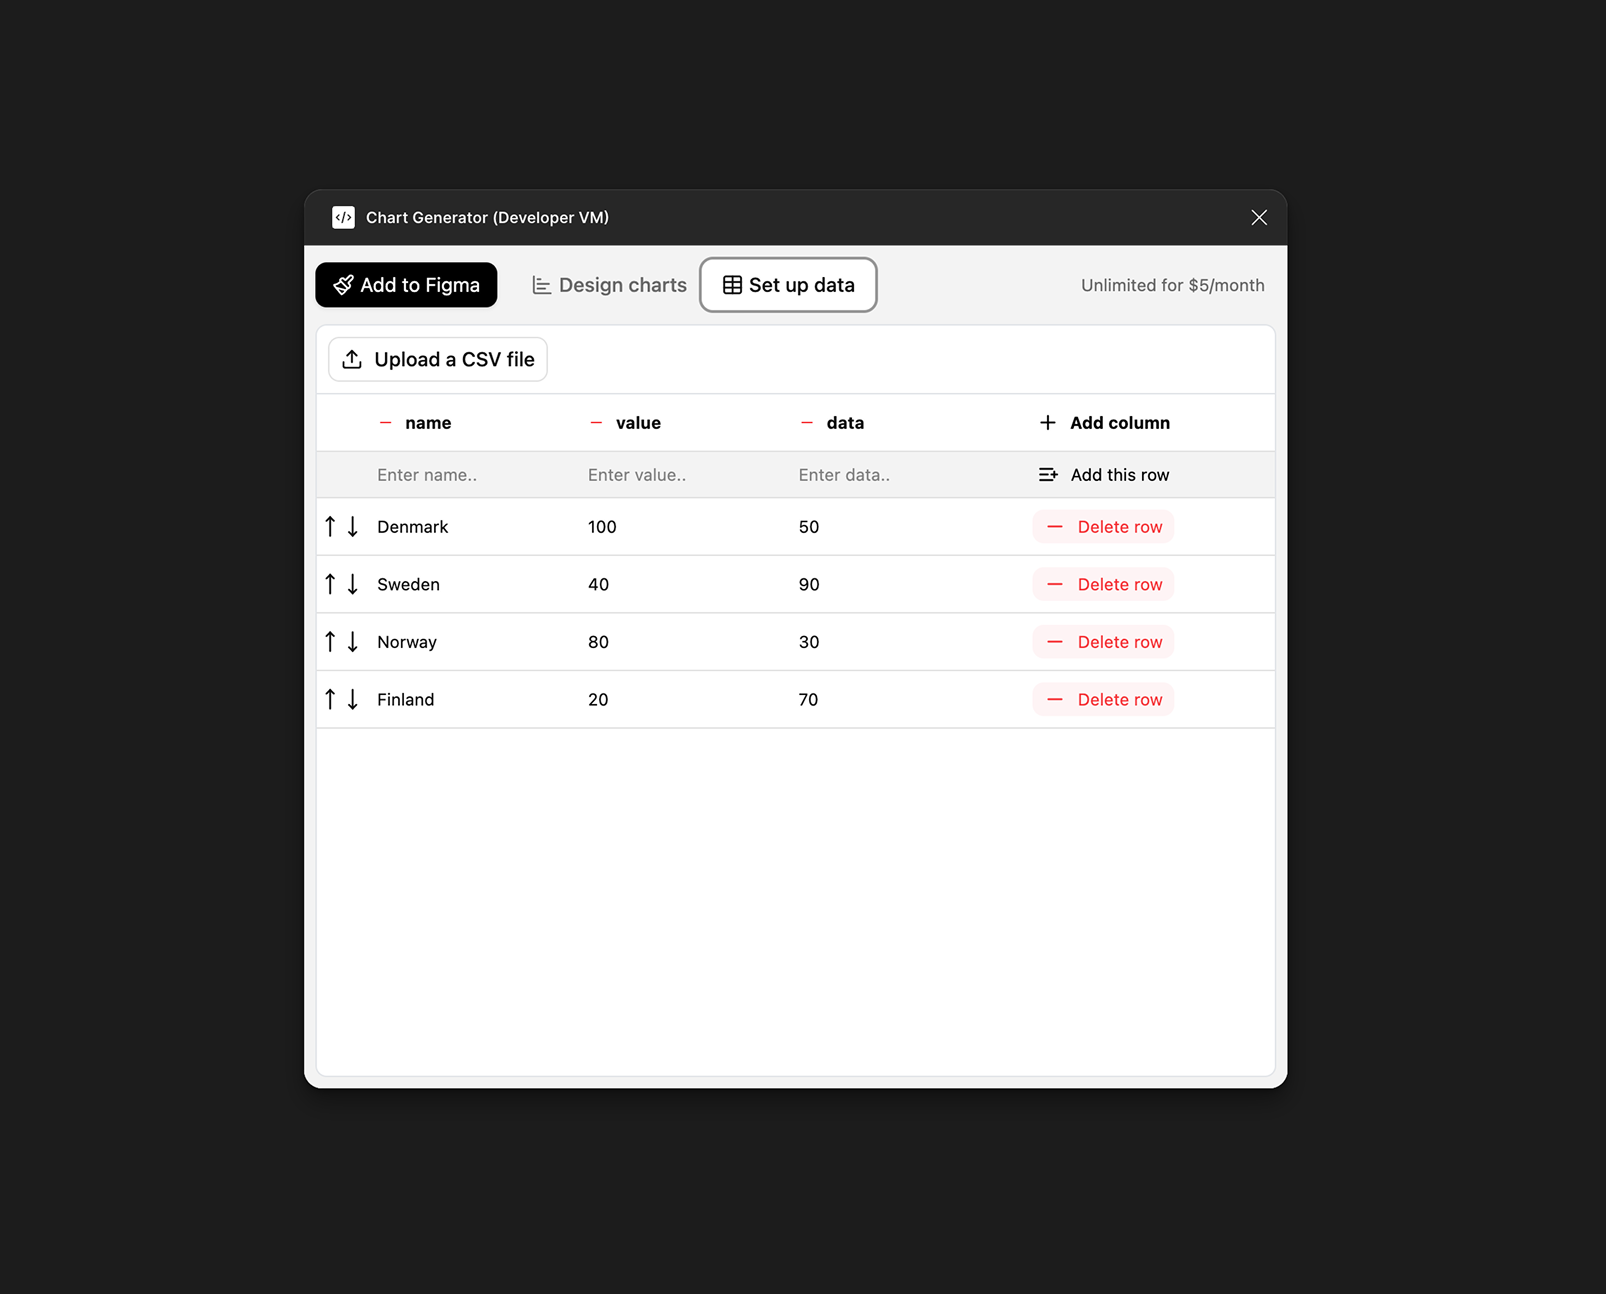
Step 5: Import CSV into Figma and create charts
You can also import your CSV files directly into the plugin and make bar charts, pie charts and many more on your CSV data.
Final
That is it! Now you can generate lots of different charts directly in Figma.
Chart Generator for Figma: Chart Generator - Bar, Pie, Line, Area and much more.. Generate Pie charts, Line charts, Bar charts, Stacked bar charts, Area charts, simple Treemaps and a couple more ✌️
I've used Recharts to create the plugin, which is a widely used charts library.
More to read

Connect on LinkedIn
Follow along on LinkedIn for more updates, tips, and insights on UX design and AI.